
== A Linux promiscuous IPv4 packet tracker for
networks (R17) ==
(Dec 2000 - Feb 2005)
iptrk is a networking monitoring program that will monitor a
set of networks and alert an operator whenever something abnormal
occurs. I developed iptrk while working at Arafura Connect.
Arafura Connect was an ISP offering dialup and wireless Internet
services. iptrk was tailor made for Arafura Connect to track traffic
volumes for billing, detect hackers and viruses, and alert of equipment
failure. Arafura Connect was liquidated in April 2003. Just before
Arafura Connect was liquidated, iptrk was turned into a GPL project.
(Screenshots are from R14. Latest revision is
R17)
Here are some of iptrk's features:
**Alerting**
- iptrk tracks a network (or networks) in realtime. It will display a
sample of packets on the screen that will immediately tell you what your
network(s) are doing, and if they are under attack, or if
services have stopped.
- It watches for abnormal traffic to and from certain IP
addresses (eg: A piece of equipment that starts to emit an unusually
high amount of traffic).
- It will detect unauthorised access to certain IP addresses
(eg: somebody SSH'ing to a private host).
- It does two types of DoSA attack detections: Port Scanning
and Address Scanning.
- All alerts are emailed to an operator (or operators).
**Reporting**
- It produces logs for each IP address on network(s), so you can see
exactly what each host is doing, the services they are accessing, and
what is accessing them.
- It produces reports (both graphical and text) via the command
line and web interface.
- The graphs are either Address Domain for the entire
network, or Time Domain for a single host. The address domain
graphs are very handy to locate the source of heavy traffic (ie- what IP
address is causing all the traffic).
- The Reporting facility tally's volumes for IP addresses in
order to bill hosted sites.
- It does archiving of data, so information is separated into
weekly or monthly time intervals.
- It has a backup facility that backs up information.
Screen Shots
iptrk isn't a packet sniffer. Unlike normal packet sniffers
(which sample the kernels "hot lists"), iptrk tracks every single
packet that hits the network interfaces. iptrk does this by queuing
IP packet information into it's own queue (which is patched into the
Linux V2.x.x kernel). Following are screen shots of the "userspace side"
of iptrk:
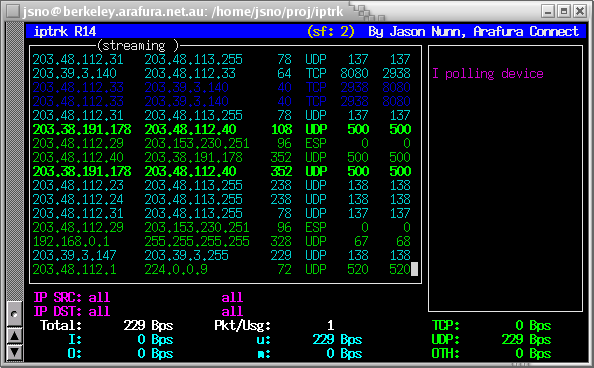
This
is iptrk running in streaming mode. It simply displays IP packet info as
they hit the network interface(s). The immediate information you can see
in the bottom part of the screen shots is updated every second producing
BPS (bytes per second) amounts. These are further broken down into
in/out/internal/martian volumes, and what type of services they are.
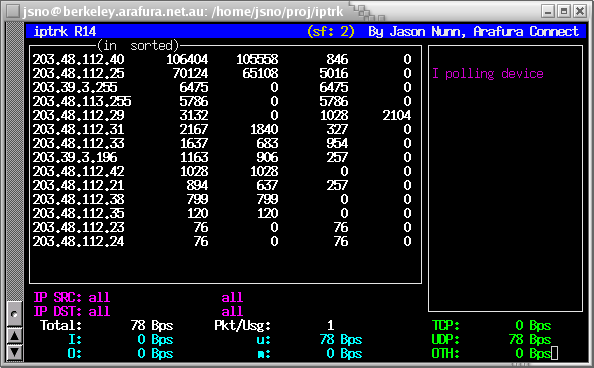
This screen produces a sorted list of IP numbers in our networks
(networks that belong to us). The above screen shot for example shows
you a list of the highest receivers of traffic (there is also a
highest senders screen). The volumes in these lists are broken
down further into Total, UDP, TCP and OTHER. These two screens are
invaluable for us, because when we get a phone call from a customer
informing us why something is slow or not working, we can instantly see
at a glance what machines are being hit the most (and who is doing it).
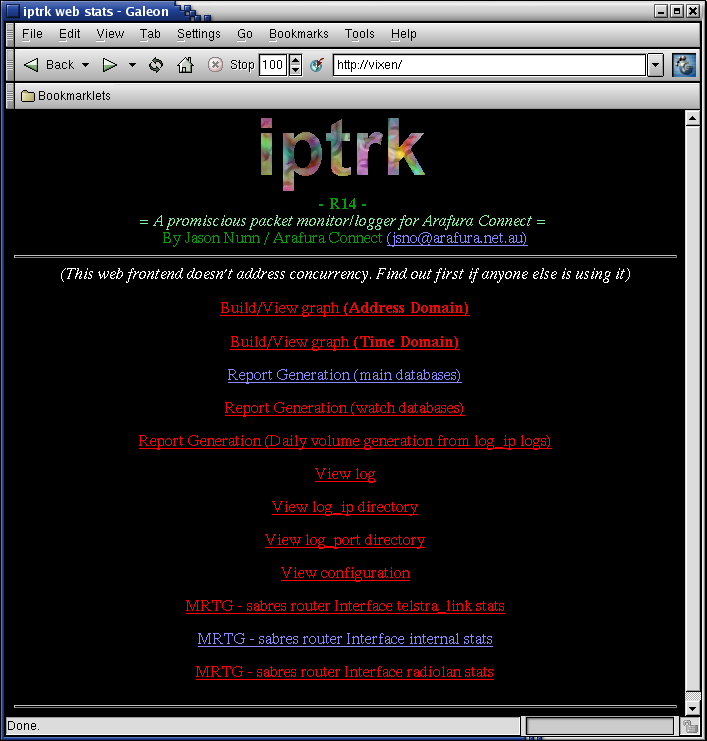
This screen (and following) is the web interface. It provides attack
detection, and information to do billing.
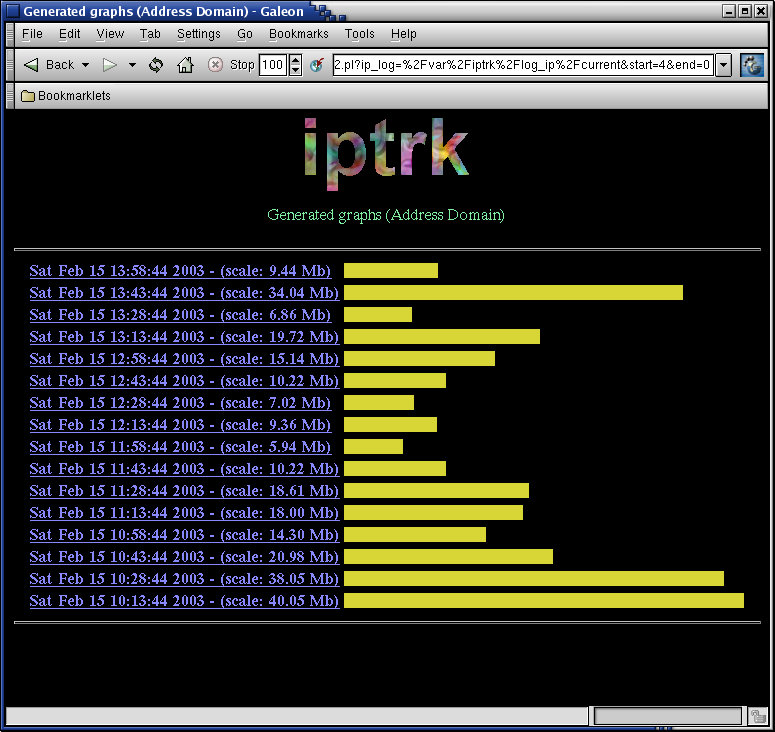
This screen (and following) is the graphing facility. They will
produce address domain histograms. When iptrk emails you telling you
somebody is hammering the network, or that your network is getting
DoSA'ed, then you can jump in here and see at a glance who is the
culprit (this is iptrk's most powerful and most used facility).
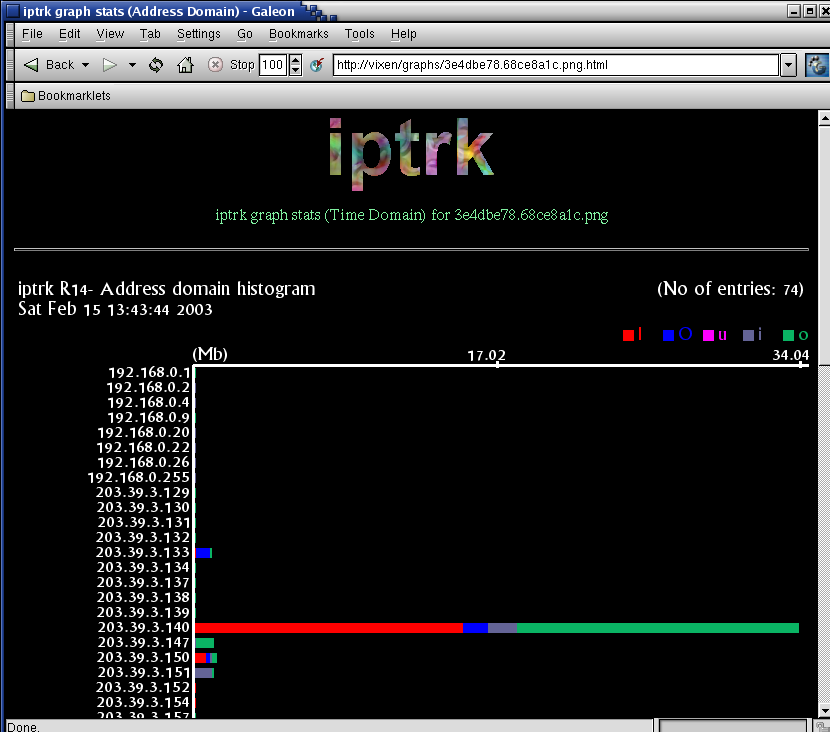
This is an "Address Domain" graph. The 203.39.3.140 address was one
of our Web Cache servers at Arafura Connect. The RED bit of the bar
tells you the amount of traffic that has come in from the Internet (come
in from outside our network(s)), The BLUE bit tells you the amount of
traffic that has gone out to the Internet, The GREY bit tells you the
amount of traffic this machine has received from internal machines
(within our network), and the GREEN bit tells you the amount of traffic
that this machine has sent to internal machines (within our network).
Nb/ Data is broken up in this fashion because the Arafura Connect
networks were segmented. Internal traffic tally's were often meaningless,
but also relevant. Also, Arafura Connect used to charge different rates
for Internal and External traffic. Here is the "time domain" graphing
facility--
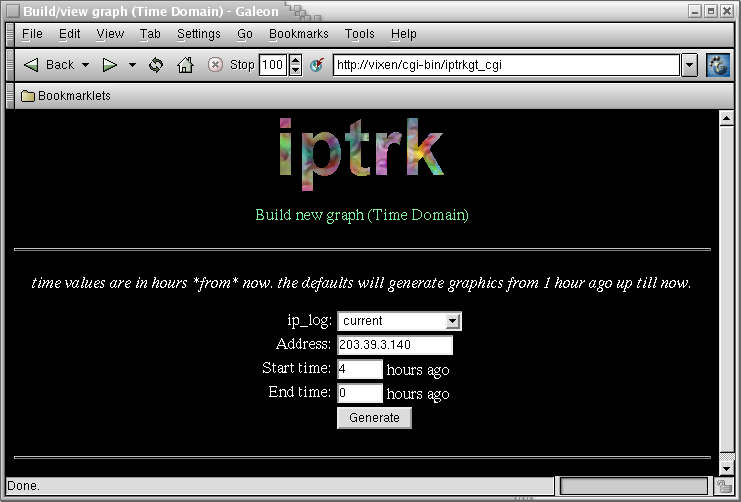
Here we set the address and time range.
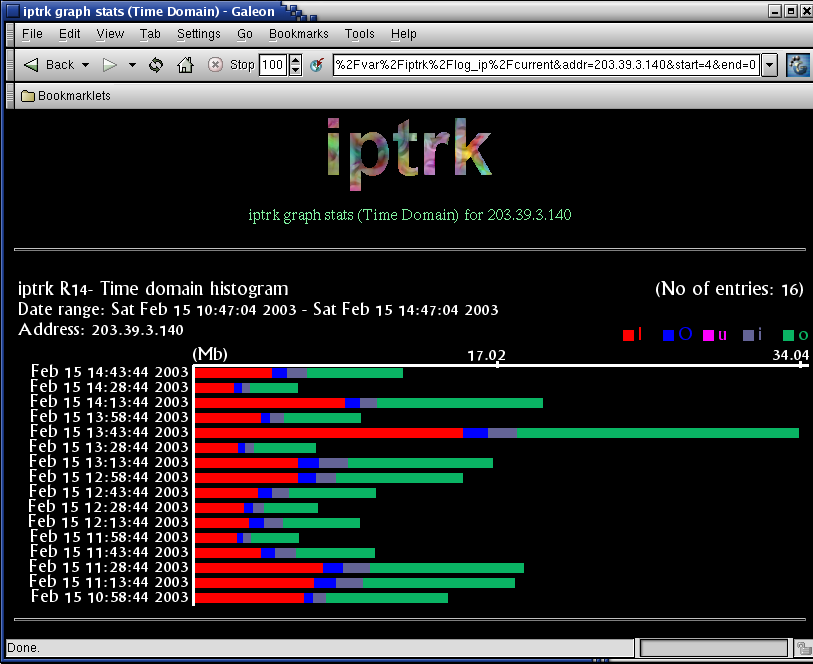
This is a "Time Domain" graph for 203.39.3.140.
Monitoring Strategies
There's a number of ways iptrk can be configured. It's fairly
important to know the advantages and limitations. There's only three
possible ways (I can think of) of configuring iptrk on a network--
Internal monitoring, Untranslated Gateway Monitoring, and Translated
Gateway Monitoring.
- Internal monitoring: This is
how we did it at Arafura Connect. As the network was heavily segmented,
we had hubs off the main "sabres" router, with the iptrk machine connected
to each. The main critical services were also connected to the main hub.
Other lesser services, dialup users and the RadioLAN users were segmented.
By doing it this way, iptrk was able to see all activities on the
important services, and see all traffic going to and from the Internet.
The 203.39.3.128 and 203.48.12.0 networks it was
monitoring were physical networks, and the main "sabres" router did no
translations. This is the scenario iptrk was designed for-- to sit in the
corner and eaves-drop. With no segmentation, iptrk gives a perfect account
of your network. With segmentation... things are less accurate, depending
on what's being segmented (this is where you have to be careful when
using switches).
- Untranslated Gateway Monitoring: Here you have a physical network,
with a Linux gateway. iptrk is on the gateway, and the gateway routes
traffic with no network translation. This is a perfect and simple
scenario. iptrk will see all network activity going in and out of
network. Unfortunately, this scenario is very uncommon.
- Translated Gateway Monitoring:
Same as above, accept the gateway NAT's. This is the scenario at my
current place of employment (Leal Technology, 2003). Our main gateway is
a Linux machine. On it we run iptrk. In this scenario, we see everything
(This is the most common network configuration used).
This model has a disadvantage-- Packet mangling makes monitoring very
confusing. iptrk hooks packets at a low part of the network stack where
all packets can be seen, but are untranslated (There's nothing I can do
about this without serious kernel modification). There are two
workarounds if accurate volume tracking and intrusion detection are
essential:
- You can run proxies on the gateway so that all internal services
connect to the actual gateway itself (a very ugly workaround).
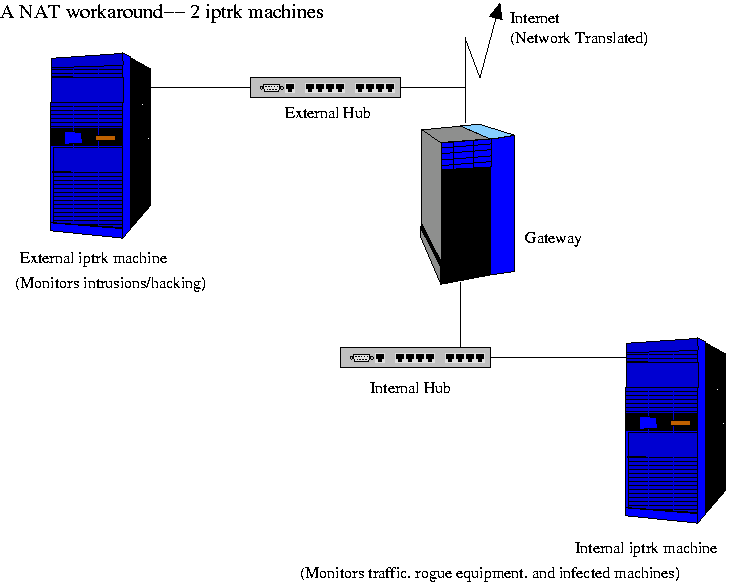
Have two separate iptrk
machines. One monitoring the internal network, and the other
monitoring the external network. The internal iptrk machine will track
traffic volumes, and the external iptrk machine monitors intrusions (a
much more elegant solution !).
Iptrk supports both the 2.4.x and 2.6.x kernels. It has been
written in C, with a web and ncurses frontend. Some of the CGI frontend
was written in Perl by Peter Green (Arafura Connect's
ex-Director/Manager).
Availability-
ftp.ibiblio.org